Tag Archives: #sun

How Planets Can Affect The Sun? (Planetary Science)

The Institute of Astrophysics of Andalusia (IAA-CSIC) is involved in developing a theory that supports the hypothesis that planets affect the Sun’s magnetic activity. It shows how the small influence of the planets could set a rhythm in a system like the Sun that, if confirmed, would allow events such as solar storms to be predicted more accurately 

In 2012, a study in which the Institute of Astrophysics of Andalusia (IAA-CSIC) participated published the hypothesis that the planets could influence the Sun: the solar magnetic activity during the last ten thousand years was reconstructed by analyzing the concentration of beryllium -10 and carbon-14 in ice from Antarctica and Greenland and compared with the movement of the planets around the Sun. Coincidences were found that suggested a link, a result opposed to the general conviction that the influence of the planets on the Sun is negligible. A theoretical explanation of how this could happen is published today, a new model that, if confirmed, will allow more accurate predictions of solar phenomena.

NEW EXPLANATION FOR A CONTROVERSIAL HYPOTHESIS

An international scientific team comprising researchers from the IAA-CSIC, the EAWAG of the Swiss Federal Institute of Technology (ETH) and the Zurich University of Applied Sciences (ZHAW) proposes an explanation for how the small tidal effect of the planets could influence the Sun’s magnetic activity: stochastic resonance. Under certain conditions, this phenomenon can amplify weak, mostly periodic signals to the point where they produce significant consequences.

The stochastic resonance mechanism was proposed in 1981 to explain the alternation between terrestrial glacial and interglacial periods as a consequence of the variation of the Earth’s orbital parameters (known as the Milankovitch theory), and is related to the concept of bistability.

The Sun has an eleven-year cycle, during which its magnetic activity (manifested in the form of spots, explosions and ejections of matter into interplanetary space) ranges from a minimum to a maximum. But there are other cycles of longer periods. “We have been able to show that the Sun has two stable states of activity: an active state with great amplitude and high solar activity, and a calmer state with a small amplitude and less solar activity –indicates Carlo Albert, an EAWAG-ETH researcher involved in the study–. It would be a bistable system: we suppose that the Sun jumps between these two states due to the turbulence in its interior”. And, since turbulence occurs randomly, these changes would be expected to occur in a completely irregular and unpredictable way.

Data for measuring solar activity suggest, however, that the jump from one state to another does not occur randomly, but often has a rate of about two hundred years. It would be a cycle superimposed on the eleven-year cycle, which the 2012 work attributed to the influence of the planets but without explaining how such small bodies could affect the Sun, whose mass constitutes 99.86% of the entire Solar System.

In the work published today in the Astrophysical Journal Letters, a way to amplify that influence is proposed. “The ingredients of our model are three: bistability, a periodically modulated signal (coming from the weak tidal force exerted by the planets), and noise in the system, caused by the turbulent convection existing in an area of ​​the Sun that goes from the surface to a depth of about 200,000 kilometers –indicates Antonio Ferriz Mas, IAA-CSIC researcher and professor at the University of Vigo who participates in the work–. There is an optimal noise intensity such that the weak signal from the planets’ tidal forces is amplified enough to influence the generation of the Sun’s magnetic field.
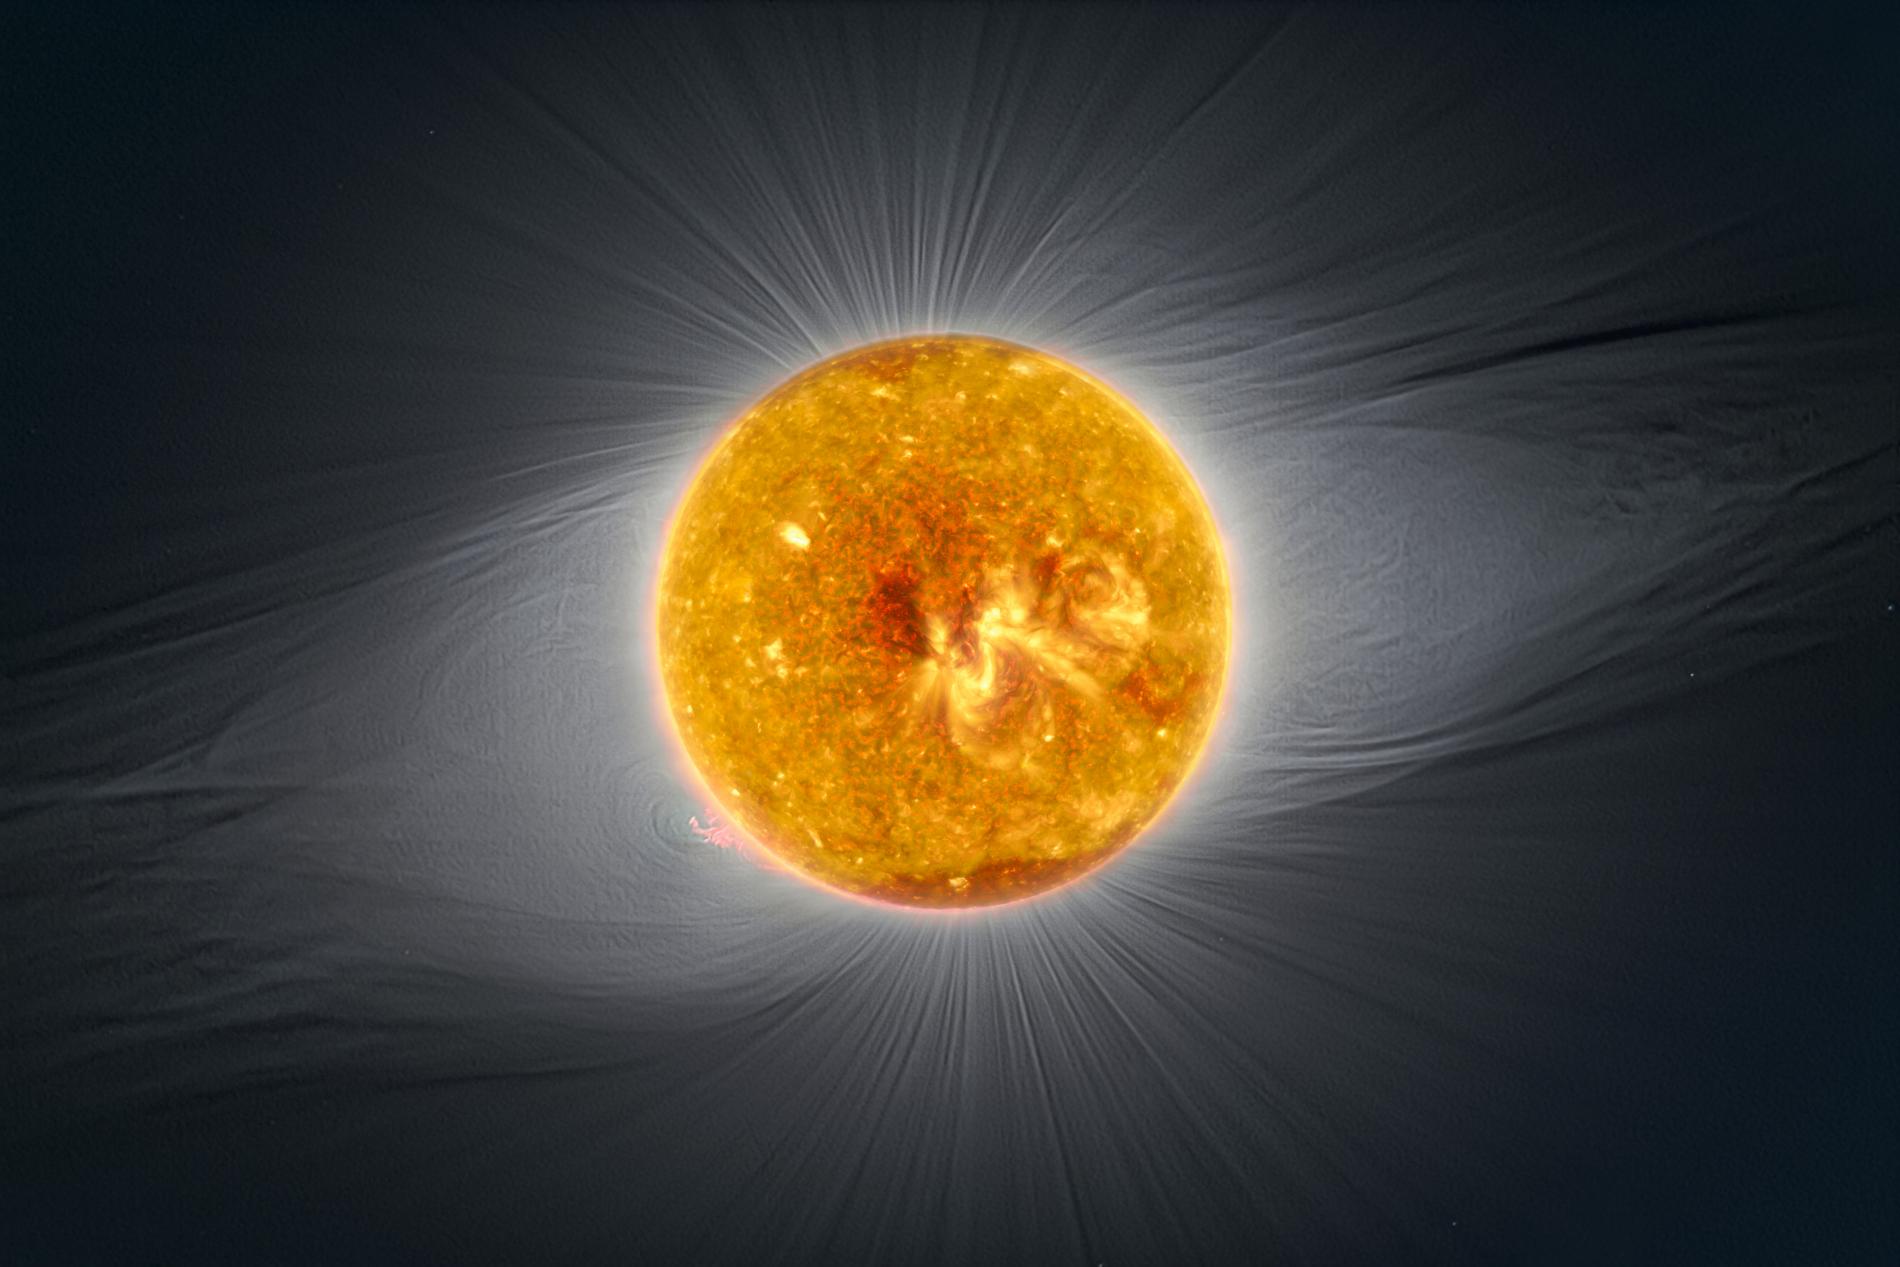
Image of the Sun combining data at various wavelengths and showing the complexity of the solar magnetic field. A large active region can be seen in the center of the solar disk. Credit: ESO/P. Horálek/SOHO (NASA&ESA)/SDO (NASA).

TOWARDS A NEW GRAND SOLAR MINIMUM?

In a next step, the team will study to what extent observations of solar activity over the past centuries can be reproduced with this method. This would confirm the theory and also allow one more step: to predict solar activity for the next decades and centuries.

Such a prediction would be of great interest, since it seems that we are facing a turning point in solar activity. According to the 2012 hypothesis, now supported by this work, the Sun is at the end of an active phase and slowly moving towards a calmer one, and the first signs that the eleven-year cycle is weakening have been observed.

These quiet phases are known as great minima, and the data suggests that the Sun has experienced several over the past millennia. The last occurrence of a great minimum, which took place between approximately 1645 and 1715, coincided with the most intense stage of an especially cold period in much of Europe, known as the Little Ice Age (although it is not clearly demonstrated that there is a cause-effect relationship between both phenomena). It will, however, be a few more years before we know for sure whether the Sun will enter a new grand minimum.
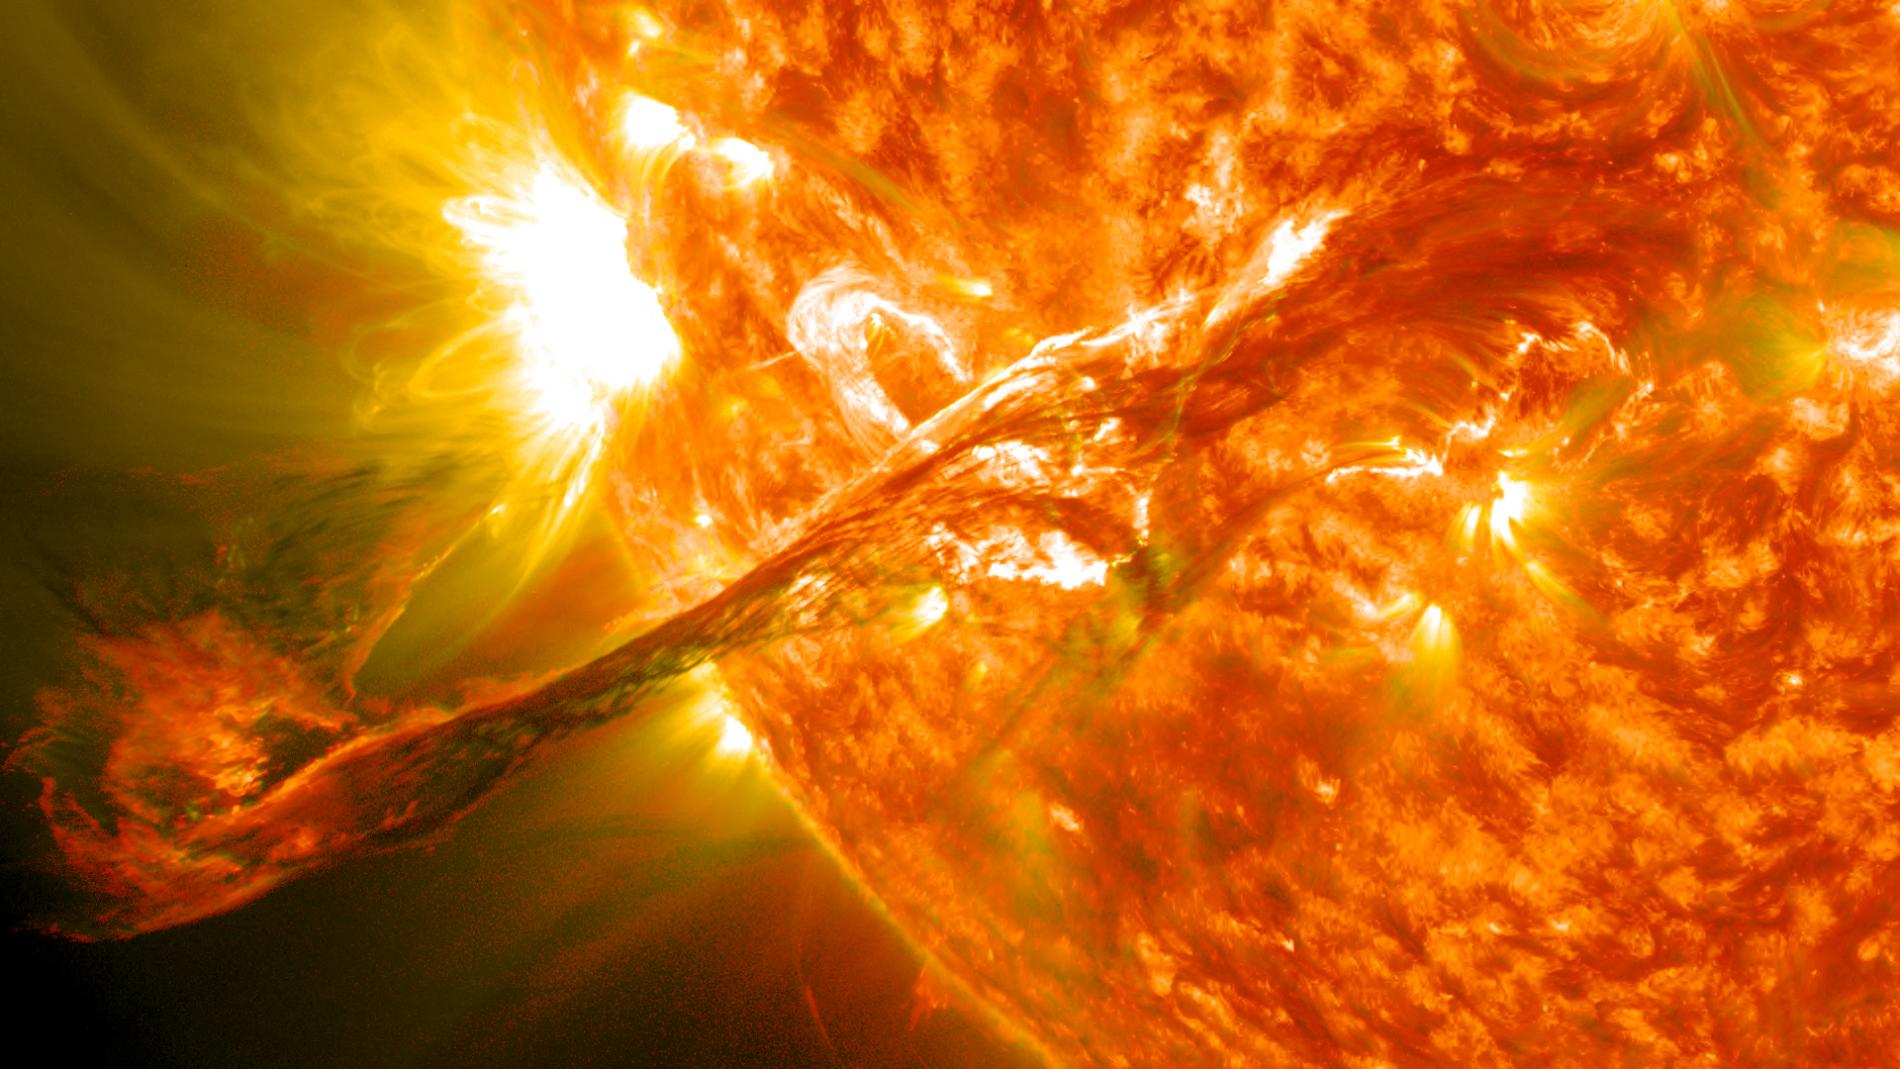
Filament of solar material ejected into space during a coronal mass ejection, one of the phenomena associated with solar magnetic activity. Credit: NASA.

Reference: 

C. Albert, A. Ferriz-Mas et al. “Can Stochastic Resonance explain Recurrence of Grand Minima?”. Astrophysical Journal Letters, July 2021. https://iopscience.iop.org/article/10.3847/2041-8213/ac0fd6


Provided by IAA CISC

Artificial Intelligence Helps Improve NASA’s Eyes on the Sun (Planetary Science)

A group of researchers is using artificial intelligence techniques to calibrate some of NASA’s images of the Sun, helping improve the data that scientists use for solar research. The new technique was published in the journal Astronomy & Astrophysics on April 13, 2021. 

A solar telescope has a tough job. Staring at the Sun takes a harsh toll, with a constant  bombardment by a never-ending stream of solar particles and intense sunlight. Over time, the sensitive lenses and sensors of solar telescopes begin to degrade. To ensure the data such instruments send back is still accurate, scientists recalibrate periodically to make sure they understand just how the instrument is changing. 

Launched in 2010, NASA’s Solar Dynamics Observatory, or SDO, has provided high-definition images of the Sun for over a decade. Its images have given scientists a detailed look at various solar phenomena that can spark space weather and affect our astronauts and technology on Earth and in space. The Atmospheric Imagery Assembly, or AIA, is one of two imaging instruments on SDO and looks constantly at the Sun, taking images across 10 wavelengths of ultraviolet light every 12 seconds. This creates a wealth of information of the Sun like no other, but – like all Sun-staring instruments – AIA degrades over time, and the data needs to be frequently calibrated.  

Seven of the ultraviolet wavelengths observed by the AIA on NASA’s SDO. The top row is taken from May 2010 and the bottom row shows from 2019, without any corrections, showing how the instrument degraded over time.
This image shows seven of the ultraviolet wavelengths observed by the Atmospheric Imaging Assembly on board NASA’s Solar Dynamics Observatory. The top row is observations taken from May 2010 and the bottom row shows observations from 2019, without any corrections, showing how the instrument degraded over time.Credits: Luiz Dos Santos/NASA GSFC

Since SDO’s launch, scientists have used sounding rockets to calibrate AIA. Sounding rockets are smaller rockets that typically only carry a few instruments and take short flights into space –  usually only 15 minutes. Crucially, sounding rockets fly above most of Earth’s atmosphere, allowing instruments on board to to see the ultraviolet wavelengths measured by AIA. These wavelengths of light are absorbed by Earth’s atmosphere and can’t be measured from the ground. To calibrate AIA, they would attach an ultraviolet telescope to a sounding rocket and compare that data to the measurements from AIA. Scientists can then make adjustments to account for any changes in AIA’s data. 

There are some drawbacks to the sounding rocket method of calibration. Sounding rockets can only launch so often, but AIA is constantly looking at the Sun. That means there’s downtime where the calibration is slightly off in between each sounding rocket calibration. 

“It’s also important for deep space missions, which won’t have the option of sounding rocket calibration,” said Dr. Luiz Dos Santos, a solar physicist  at NASA’s Goddard Space Flight Center in Greenbelt, Maryland, and lead author on the paper. “We’re tackling two problems at once.” 

Virtual calibration

With these challenges in mind, scientists decided to look at other options to calibrate the instrument, with an eye towards constant calibration. Machine learning, a technique used in artificial intelligence, seemed like a perfect fit. 

As the name implies, machine learning requires a computer program, or algorithm, to learn how to perform its task.

First, researchers needed to train a machine learning algorithm to recognize solar structures and how to compare them using AIA data. To do this, they give the algorithm images from sounding rocket calibration flights and tell it the correct amount of calibration they need. After enough of these examples, they give the algorithm similar images and see if it would identify the correct calibration needed. With enough data, the algorithm learns to identify how much calibration is needed for each image.

Because AIA looks at the Sun in multiple wavelengths of light, researchers can also use the algorithm to compare specific structures across the wavelengths and strengthen its assessments.

To start, they would teach the algorithm what a solar flare looked like by showing it solar flares across all of AIA’s wavelengths until it recognized solar flares in all different types of light. Once the program can recognize a solar flare without any degradation, the algorithm can then determine how much degradation is affecting AIA’s current images and how much calibration is needed for each. 

“This was the big thing,” Dos Santos said. “Instead of just identifying it on the same wavelength, we’re identifying structures across the wavelengths.” 

This means researchers can be more sure of the calibration the algorithm identified. Indeed, when comparing their virtual calibration data to the sounding rocket calibration data, the machine learning program was spot on. 

Two lines of images of the Sun. The top line gets darker and harder to see, while the bottom row stays a consistent brightly visible image.
The top row of images show the degradation of AIA’s 304 Angstrom wavelength channel over the years since SDO’s launch. The bottom row of images are corrected for this degradation using a machine learning algorithm.Credits: Luiz Dos Santos/NASA GSFC

With this new process, researchers are poised to constantly calibrate AIA’s images between calibration rocket flights, improving the accuracy of SDO’s data for researchers. 

Machine learning beyond the Sun

Researchers have also been using machine learning to better understand conditions closer to home. 

One group of researchers led by Dr. Ryan McGranaghan – Principal Data Scientist and Aerospace Engineer at ASTRA LLC and NASA Goddard Space Flight Center –  used machine learning to better understand the connection between Earth’s magnetic field and the ionosphere, the electrically charged part of Earth’s upper atmosphere. By using data science techniques to large volumes of data, they could apply machine learning techniques to develop a newer model that helped them better understand how energized particles from space rain down into Earth’s atmosphere, where they drive space weather. 

As machine learning advances, its scientific applications will expand to more and more missions. For the future, this may mean that deep space missions – which travel to places where calibration rocket flights aren’t possible – can still be calibrated and continue giving accurate data, even when getting out to greater and greater distances from Earth or any stars.

Header image caption (same as image in the story): The top row of images show the degradation of AIA’s 304 Angstrom wavelength channel over the years since SDO’s launch. The bottom row of images are corrected for this degradation using a machine learning algorithm. Credits: Luiz Dos Santos/NASA GSFC


Provided by NASA

Researchers Reveal Characteristic Time of Stellar Flares on Sun-like Stars (Planetary Science)

Flare is a phenomenon of a sudden brightening on the surface of the Sun. Akin to solar flares, the phenomenon was also discovered on the stars other than the Sun. However, only very few stellar flare cases had been identified, and even fewer for Sun-like stars. 

In 2009, the Kepler space telescope was launched. This mission has observed the light curves of a large volume of stars. These light-curve data provide a massive number of stellar flares.

Based on the light-curve data of Kepler, a research team led by Prof. HE Han from the National Astronomical Observatories of the Chinese Academy of Sciences (NAOC) has revealed the characteristic time of stellar flares on Sun-like stars.  

The study was published in Monthly Notices of the Royal Astronomical Society on June12.

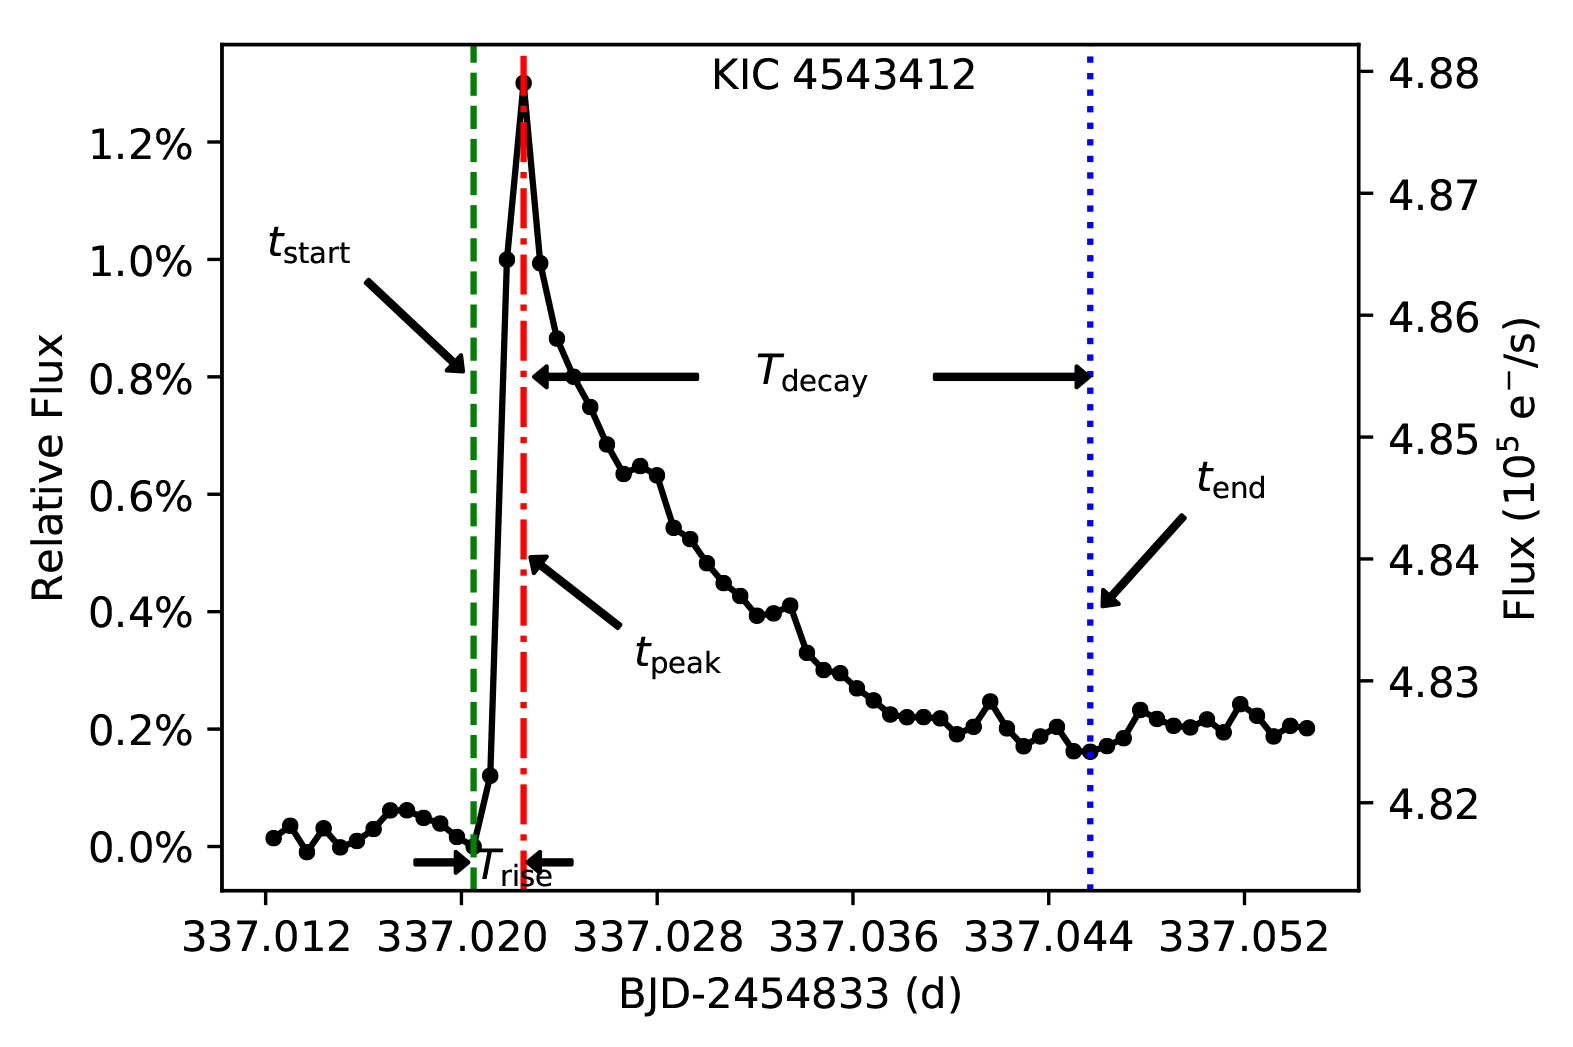
A flare has two distinct phases: the rise phase and the decay phase, which can be seen from the light curves of solar flares. “The rise phase generally represents a rapid release of magnetic field energy through a magnetic reconnection process, while the decay phase generally demonstrates a prolonged term comprising the whole cooling process,” said Prof. HE, a corresponding author of the study. The timescales of the flare rise phase and decay phase are important in flare study.

Fig. 1 An example stellar flare light curve observed by Kepler (Image by YAN et al., MNRAS, 2021) 

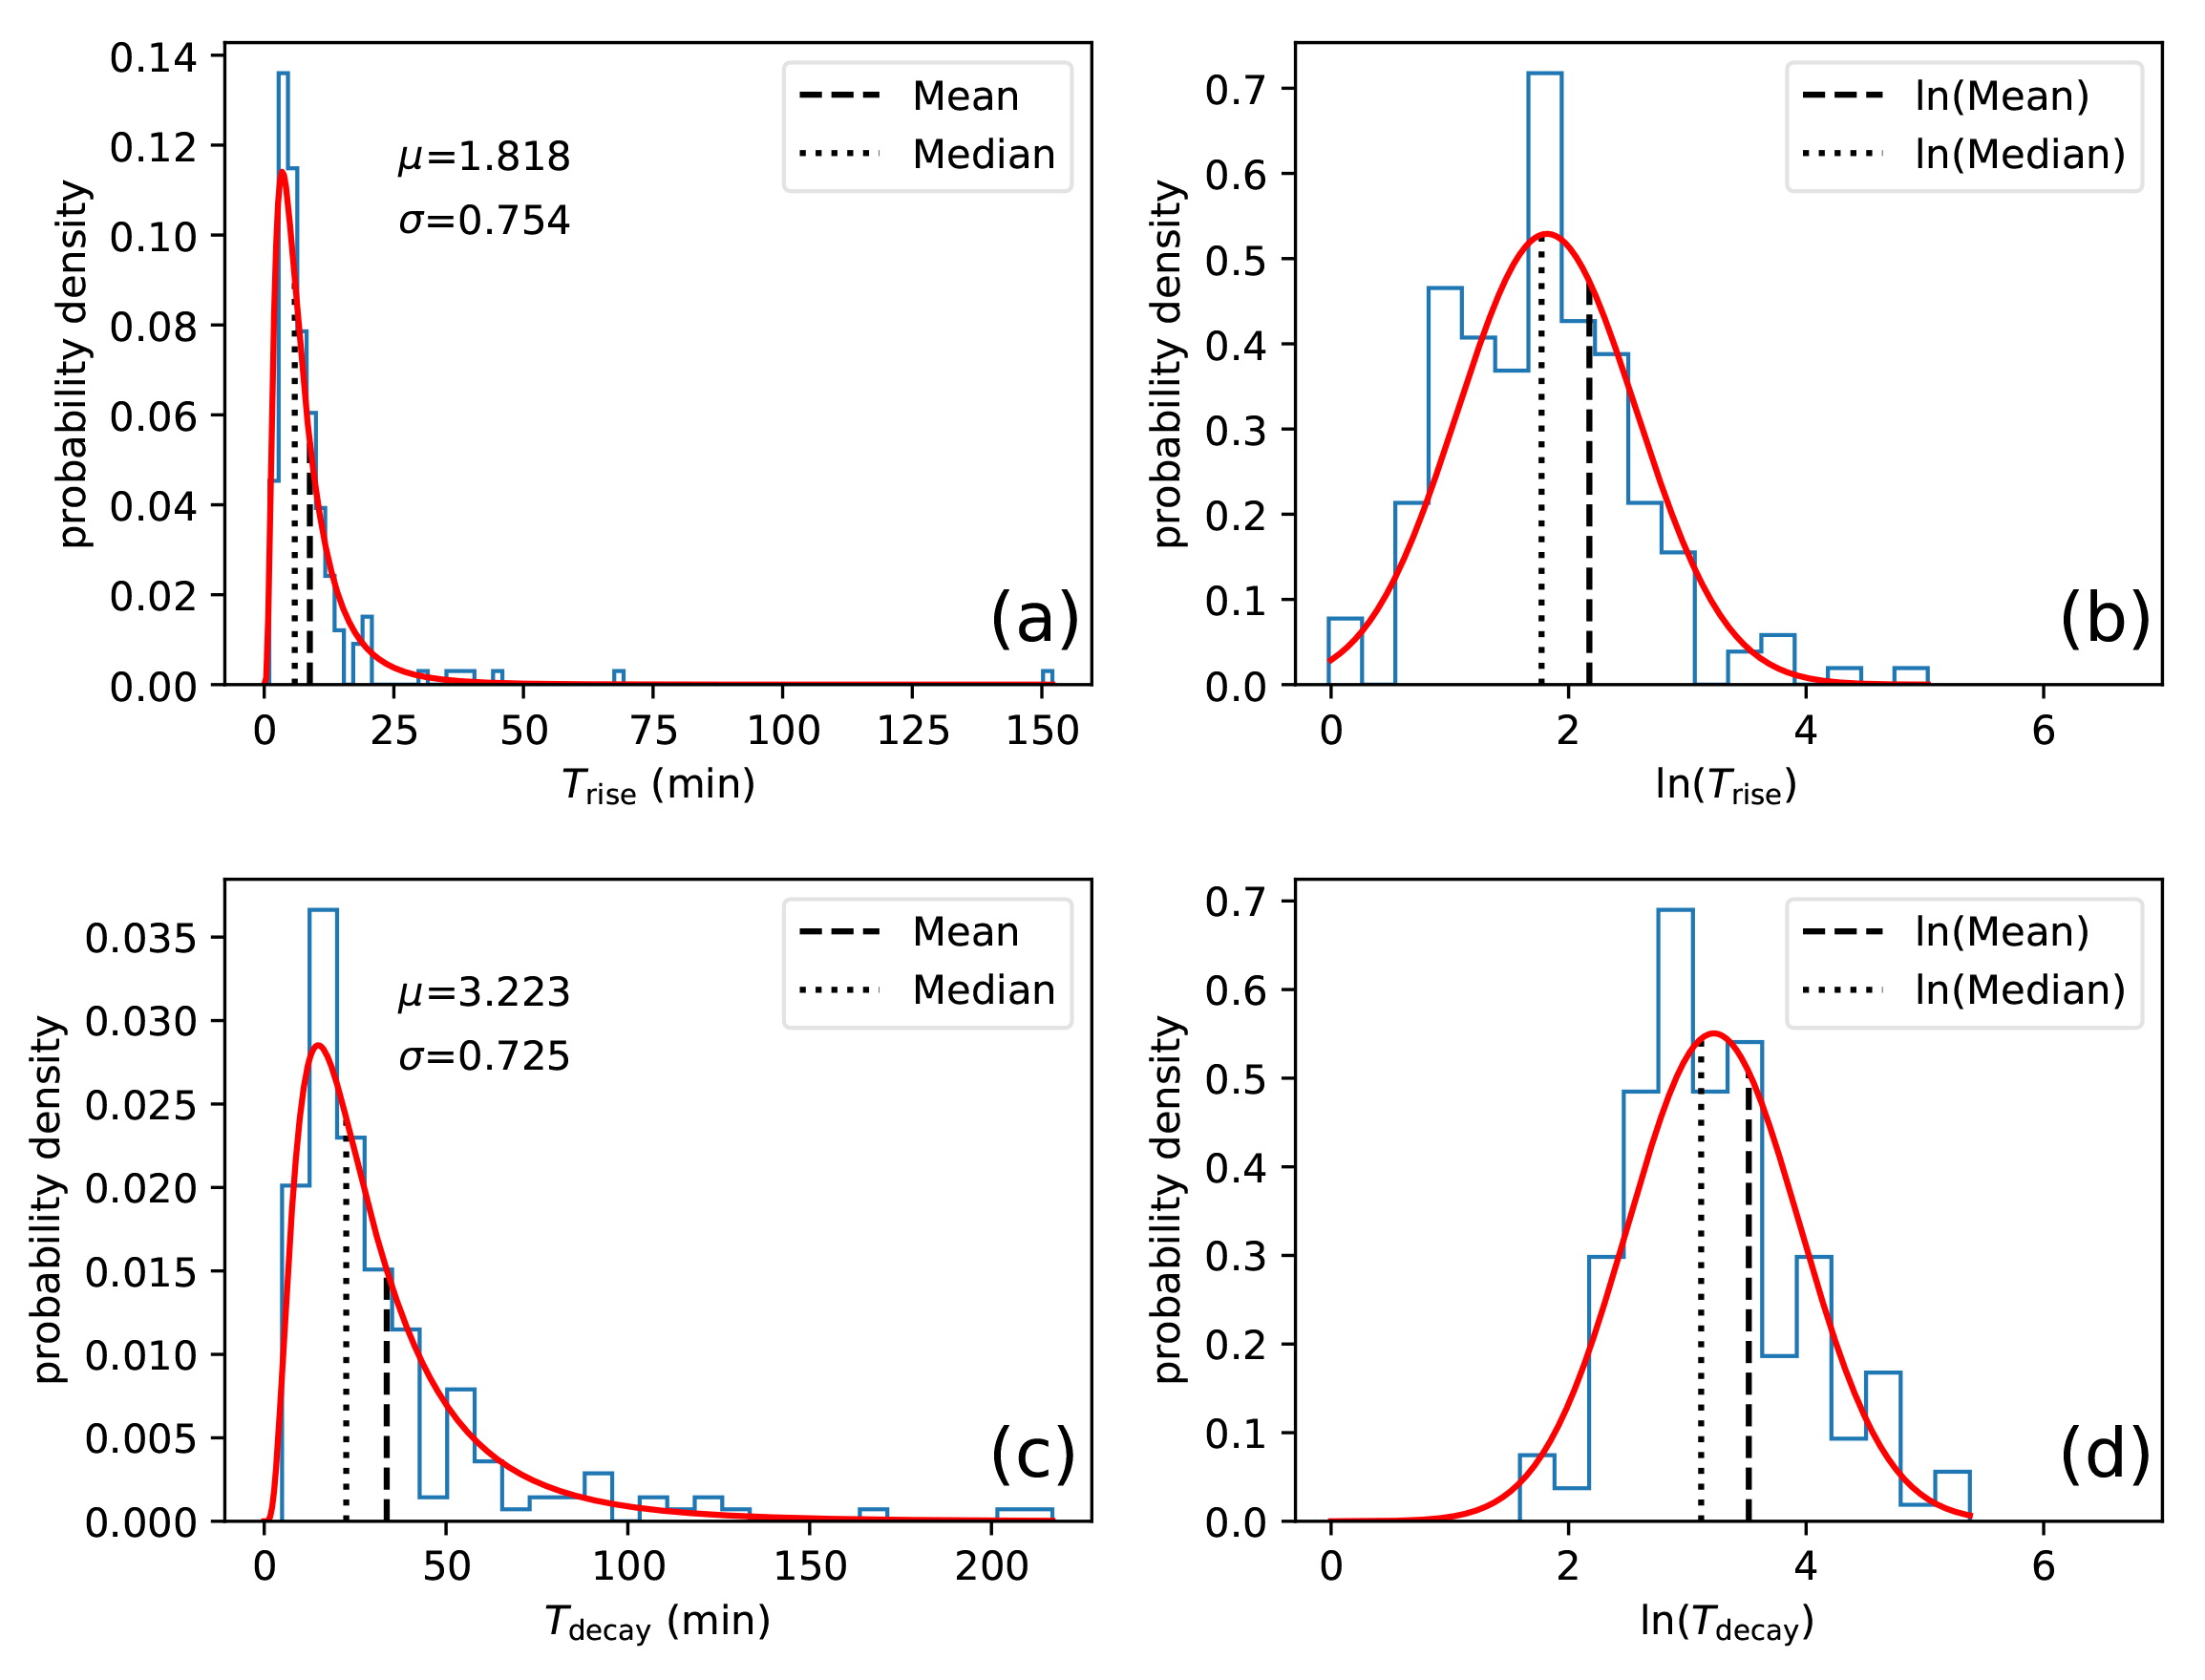
The research selected star samples that have the stellar parameters approximate to the Sun and identified 184 stellar flares from the short-cadence (SC) light curves of the Sun-like stars. The duration times of the flare rise phase and decay phase were determined for each flare sample based on the flare light-curve profile, and then a statistical analysis was performed on the obtained rise times and decay times of the flare samples. 

“For the stellar flares on Sun-like stars, the median values of the flare rise time and decay times are 5.9 min and 22.6 min, respectively. These time values for stellar flares are similar to the timescale of solar flares, which supports the idea that stellar flares and solar flares have the same physical mechanism,” said Dr. YAN Yan from NAOC, the other corresponding author of the study.

The researchers also found that both the rise time and the decay time of the stellar flares follow a lognormal distribution, showing a peak-shaped head and a long tail.

The statistical results obtained for Sun-like stars can be a benchmark of flare characteristic times when compared with other types of stars. 

In addition, stellar flare radiation is a key factor in the habitability of exoplanets within a stellar system. The result obtained in this work can act as an important input element for analyzing the impact of stellar flares to the atmosphere, space environment, and habitability of exoplanets. 

Fig. 2 Left panels: histograms (blue) and fitted lognormal distribution curves (red) for the flare rise times (upper) and decay times (lower); Right panels: normal distribution diagrams for the logarithm of the rise times and decay times. (Image by YAN et al., MNRAS, 2021) 

Reference: Y Yan, H He, C Li, A Esamdin, B L Tan, L Y Zhang, H Wang, Characteristic time of stellar flares on Sun-like stars, Monthly Notices of the Royal Astronomical Society: Letters, Volume 505, Issue 1, July 2021, Pages L79–L83, https://doi.org/10.1093/mnrasl/slab055


Provided by Chinese Academy of Sciences

uGMRT Uncovers the Signature of A Cannon Ball Fired From The Sun, Using Pulsars! (Planetary Science)

A group of nearly 20 astronomers, under the banner of Indian Pulsar Timing Array (InPTA), have for the first time detected the effect of a Coronal Mass Ejection (CME) from the Sun in the signal from a millisecond pulsar using the upgraded Giant Metrewave Radio Telescope (uGMRT). This space weather effect on a pulsar from the Sun is the first of its kind ever reported. This was possible only due to unique wideband and low frequency capabilities of the uGMRT.

The Indian Pulsar Timing Array (InPTA) is a group of nearly 20 astronomers studying pulsars, the most accurate clocks in the universe. The pulsars are the end products of massive stars. They are very massive and rotate extremely fast. As they rotate, the beams of their radio waves sweep the sky, which are seen as radio flashes with a high degree of periodicity. InPTA records signals from these clocks using the upgraded Giant Metrewave Radio Telescope (uGMRT), once every 14 days, to time these clocks to discover very low-frequency Gravitational waves. Gravitational waves were predicted by Einstein and are ripples in space and time. They change the way clocks tick as these waves pass by. While higher frequency Gravitational waves are being discovered by terrestrial detectors, like LIGO and VIRGO, the low frequency Gravitational waves can be discovered using changes in the clock period of pulsars. InPTA, along with other international pulsar timing groups, is a member of the International Pulsar Timing Array (IPTA) consortium aiming to discover a very low-frequency spectrum of Gravitational waves.

Discovering Gravitational waves requires determining the time of arrival of the radio flashes from pulsars to an accuracy of tens of nanoseconds. But, changes in the medium between us and stars produce time-varying delays and makes this precision worse. This is where the uGMRT helps to improve the precision. InPTA astronomers can measure these changes with an unprecedented precision because of the unique seamless frequency coverage of the uGMRT from 300 to 1400 MHz. While this is critical to the discovery of nanohertz Gravitational waves, this ability also allowed InPTA to uncover the effect of a solar explosion on February 23, 2019.

Our Sun produces massive explosions as its interior churns and twists its magnetic field. These massive eruptions, called Coronal Mass Ejections (CMEs), travel in space along with the solar wind, consisting of charged particles. Such an explosion

is akin to a cannon firing a cannonball. The CMEs, interacting with this solar wind, can increase the density of electrons between the Earth and the Sun. Such changes in the property of the medium between Earth and Sun affects the accuracy of measurement of periods from pulsars. Indian pulsar timing array astronomers uncovered the evidence of such a fireball using high precision pulsar timing with the uGMRT. InPTA astronomers discovered an increase in the delay in the signal from a millisecond pulsar, PSRJ2145-0750, while analysing the first year data of InPTA with the uGMRT. This excessive delay was observed on February 24, 2019. On this day, the pulsar was located away from the path of the Sun as well as the Sun was not very active. However, a weak coronal mass ejection (CME) eruption had occurred on the Solar surface the previous day. This solar event was detected by the space-based satellites and was directed towards the Earth. The large bubble of magnetized-plasma of CME was compressed by the high speed solar wind resulting in a dense plasma region along the line of sight to the pulsar. The pulsar signal passed through this highly compressed medium on 24 February 2019 causing an extra delay and an increased level of dispersion of the pulsar signal. This space weather effect on a pulsar is the first of its kind ever reported.

While this discovery was serendipitous, it may be noted that it was possible only due to unique wideband and low frequency capabilities of the uGMRT, which is one of its kind radio telescopes in the world. This discovery also demonstrates the breadth of science made possible by the uGMRT and the important role InPTA will play in the eventual detection of gravitational waves with the pulsar timing arrays. The results of their study was published in the Astronomy & Astrophysics journal on July 6, 2021 (https://doi.org/10.1051/0004-6361/202140340). The preprints is available in https://arxiv.org/abs/2101.05334

Based on the article “High precision measurements of interstellar dispersion measure with the upgraded GMRT“, by M. A. Krishnakumar et al. Published in Astronomy & Astrophysics, 2021, 651, A5


Provided by NCRA-TIFR

Long-period Oscillations of the Sun Discovered (Planetary Science)

Ten years of data from NASA’s Solar Dynamics Observatory combined with numerical models reveal the deep low musical notes of the Sun.

A team of solar physicists led by Laurent Gizon of the Max Planck Institute for Solar System Research (MPS) and the University of Göttingen in Germany has reported the discovery of global oscillations of the Sun with very long periods, comparable to the 27-day solar rotation period. The oscillations manifest themselves at the solar surface as swirling motions with speeds on the order of 5 kilometers per hour. These motions were measured by analyzing 10 years of observations from NASA’s Solar Dynamics Observatory (SDO). Using computer models, the scientists have shown that the newly discovered oscillations are resonant modes and owe their existence to the Sun’s differential rotation. The oscillations will help establish novel ways to probe the Sun’s interior and obtain information about our star’s inner structure and dynamics. The scientists describe their findings in a letter to appear today in the journal Astronomy & Astrophysics.

High-latitude inertial mode: The east-west velocity associated with the retrograde propagating mode of oscillation. Left: observations using the SDO/HMI instrument. Right: numerical model. Sound: filtered data (86 ± 10 nHz) shifted to the audible spectrum; the sound variations inform us about the excitation and damping of the mode. © MPI

In the 1960’s the Sun’s high musical notes were discovered: The Sun rings like a bell. Millions of modes of acoustic oscillations with short periods, near 5 minutes, are excited by convective turbulence near the solar surface and are trapped in the solar interior. These 5-minute oscillations have been observed continuously by ground-based telescopes and space observatories since the mid 1990’s and have been used very successfully by helioseismologists to learn about the internal structure and dynamics of our star – just like seismologists learn about the interior of the Earth by studying earthquakes. One of the triumphs of helioseismology is to have mapped the Sun’s rotation as a function of depth and latitude (the solar differential rotation).

In addition to the 5-minute oscillations, much longer-period oscillations were predicted to exist in stars more than 40 years ago, but had not been identified on the Sun until now. “The long-period oscillations depend on the Sun’s rotation; they are not acoustic in nature”, says Laurent Gizon, lead author of the new study and director at the MPS. “Detecting the long-period oscillations of the Sun requires measurements of the horizontal motions at the Sun’s surface over many years. The continuous observations from the Helioseismic and Magnetic Imager (HMI) onboard SDO are perfect for this purpose.”

Critical-latitude inertial mode: The east-west velocity associated with the retrograde propagating mode of oscillation. Left: observations using the SDO/HMI instrument. Right: numerical model. Sound: filtered data (73 ± 10 nHz) shifted to the audible spectrum; the sound variations inform us about the excitation and damping of the mode. © MPI

The team observed many tens of modes of oscillation, each with its own oscillation period and spatial dependence. Some modes of oscillation have maximum velocity at the poles (movie 1), some at mid-latitudes (movie 2), and some near the equator (movie 3). The modes with maximum velocity near the equator are Rossby modes, which the team had already identified in 2018. “The long-period oscillations manifest themselves as very slow swirling motions at the surface of the Sun with speeds of about 5 kilometers per hour – about how fast a person walks”, says Zhi-Chao Liang from MPS. Kiran Jain from NSO, together with B. Lekshmi and Bastian Proxauf from MPS, confirmed the results with data from the Global Oscillation Network Group (GONG), a network of six solar observatories in the USA, Australia, India, Spain, and Chile.

To identify the nature of these oscillations, the team compared the observational data to computer models. “The models allow us to look inside the Sun’s interior and determine the full three-dimensional structure of the oscillations”, explains MPS graduate student Yuto Bekki. To obtain the model oscillations, the team began with a model of the Sun’s structure and differential rotation inferred from helioseismology. In addition, the strength of the convective driving in the upper layers, and the amplitude of turbulent motions are accounted for in the model. The free oscillations of the model are found by considering small-amplitude perturbations to the solar model. The corresponding velocities at the surface are a good match to the observed oscillations and enabled the team to identify the modes (see movies).

Equatorial Rossby mode: The north-south velocity associated with the retrograde propagating mode of oscillation. Left: observations using the SDO/HMI instrument. Right: numerical model. Sound: filtered data (269 ± 10 nHz) shifted to the audible spectrum; the sound variations inform us about the excitation and damping of the mode. © MPI

“All of these new oscillations we observe on the Sun are strongly affected by the Sun’s differential rotation”, says MPS scientist Damien Fournier. The dependence of the solar rotation with latitude determines where the modes have maximum amplitudes. “The oscillations are also sensitive to properties of the Sun’s interior: in particular to the strength of the turbulent motions and the related viscosity of the solar medium, as well as to the strength of the convective driving,” says Robert Cameron from MPS. This sensitivity is strong at the base of the convection zone, about two hundred thousand kilometers beneath the solar surface. “Just like we are using acoustic oscillations to learn about the sound speed in the solar interior with helioseismology, we can use the long-period oscillations to learn about the turbulent processes”, he adds.

“The discovery of a new type of solar oscillations is very exciting because it allows us to infer properties, such as the strength of the convective driving, which ultimately control the solar dynamo”, says Laurent Gizon. The diagnostic potential of the long-period modes will be fully realized in the coming years using a new exascale computer model being developed as part of the project WHOLESUN, supported by a European Research Council 2018 Synergy Grant.

Featured image: The east-west velocity associated with the retrograde propagating mode of oscillation. Left: observations using the SDO/HMI instrument. Right: numerical model. © MPS/Z-C Liang


Reference: Laurent Gizon et al.:Solar inertial modes: Observations, identification, and diagnostic promise, Astronomy & Astrophysics, forthcoming article Source DOI


Provided by Max Planck Institute

New Cycle, the Sun Begins To Stretch (Planetary Science)

On July 3, at 4:29 pm Italian time, our star emitted an intense solar flare – the first of the X-class of the new solar cycle. Among the instruments that recorded it there are also those of the Swelto space weather laboratory, of INAF in Turin

After the minimum reached in 2020, the solar activity cycle ( number 25 ) is slowly restarting following its quasi-periodic trend of about 11 years . In recent months, the number of active regions on the Sun (i.e. regions with a high concentration of magnetic fields and possible sites of solar flares) has progressively increased. After some first so-called “class M” flares (of medium-high intensity), two weeks ago one of these regions produced the first “class X” (ie high intensity) solar flare of the new cycle of solar activity. The event took place in particular on 3 July, with an intensity peak at 14:29 Ut (16:29 in Italy) and a duration of about 16 minutes as measured by NASA’s Goes satellite, and was observed in particular by the Sdo probe also by NASA which, in orbit around to the Earth, it monitors the Sun 24 hours a day.

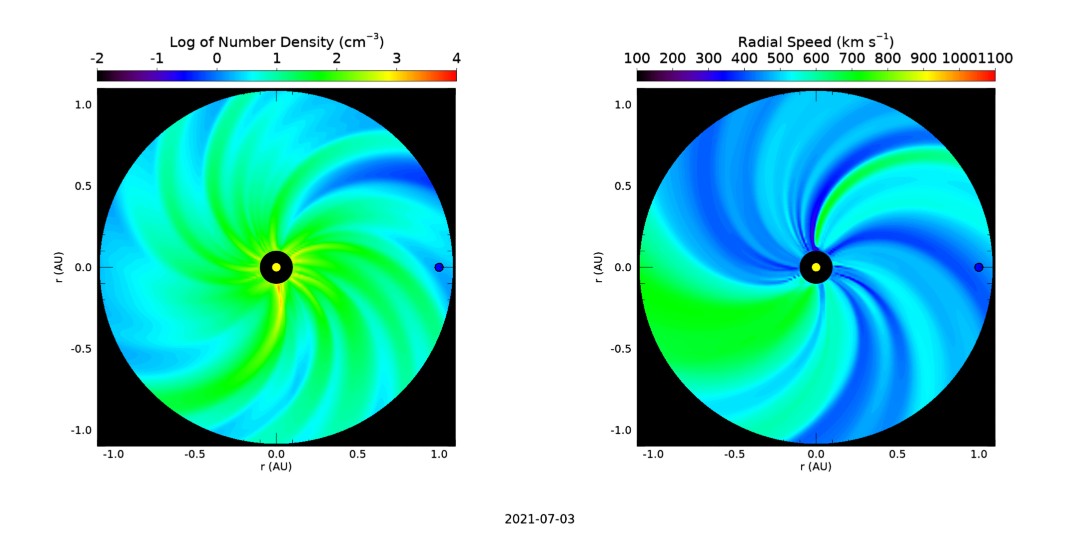
When the flare occurred, the active region was near the western edge of the Sun, in a position that could make the event more dangerous for the Earth, because the high-energy particles (the so-called Seps ) eventually accelerated in the event. they are more likely to propagate towards our planet following the spiral of the interplanetary magnetic field (called Parker’s spiral ). This is why it is important to monitor not only solar activity, but also the shape of the Parker spiral. This is reconstructed day by day by the Swelto project through a magnetohydrodynamic numerical simulation based on a model called Rimap, developed in a collaboration between the INAF of Turin and the University of Palermo. The image below shows the shape of this spiral as reconstructed in real time by Rimap for July 3 and displayed in the distribution on the ecliptic plane of the density (left) and speed (right) of the solar wind. In these figures the yellow dot shows the position of the Sun, while the blue dot (both not to scale) shows the position of the Earth.

Parker spiral reconstructed in real time with the Rimap model for 3 July. Credits: Swelto / Inaf Torino

The effects of this event also reverberated on Earth, causing a radio emission burst and a very particular geomagnetic field disturbance called magnetic crochet . This type of disturbance in the Earth’s magnetic field is observed only rarely, and has the unique characteristic of occurring not a few days after the eruptive event on the Sun, as sometimes happens when the solar eruption spreading from the Sun to the Earth finally hits our magnetosphere. On the contrary, in the case of a magnetic crochetthe disturbance on the ground occurs in immediate concomitance with the flare itself. In the case of particularly intense solar flares and with a particularly rapid increase in brightness in the X-rays, the arrival of high-energy photons (which propagate from the Sun to the Earth in just over 8 minutes) causes a sudden increase in the ionization of the high Earth’s atmosphere, the ionosphere. This causes a sudden intensification of the electric currents flowing through it, which are associated with magnetic fields which in turn disturb the earth’s field.

23.4 kHz radio signal observed by the Sid monitor in Turin on 3/7/2021. Credits: Swelto / Inaf Torino

The associated ionospheric disturbance – referred to as Sudden ionospheric disturbance, or  Sid– it was also very fast and intense, and was also observed by the Sid monitor still in operation as part of the Swelto project at the INAF in Turin. The two graphs on the side show in particular the 23.4 kHz radio signal observed by the Sid monitor in Turin on the day of the event (bottom) and for comparison also the previous day (top). In addition to the typical variation in the signal due to changes in ionospheric density between day (region in orange) and night (region in blue) and observable in both cases, the graph of July 3 shows a very evident peak around 15 Ut and due precisely to the ionospheric disturbance associated with the solar flare of the same day observed about half an hour earlier from space. The effects on Earth of this event were therefore also observed by us.

In the coming months and years, solar activity will become increasingly important, and phenomena of this type will occur with increasing frequency. The monitoring and study of the Sun continues with observations from Earth and from space, through large international projects – (such as the ESA probe and Nasa Solar Orbiter – but also with small local projects, such as Swelto, which can still make their contribution. .

To know more:


Provided by INAF

Significant Solar Flare Erupts From Sun (Planetary Science)

The sun emitted a significant solar flare peaking at 10:29 a.m. EDT on July 3, 2021. NASA’s Solar Dynamics Observatory, which watches the sun constantly, captured an image of the event.

Solar flares are powerful bursts of radiation. Harmful radiation from a flare cannot pass through Earth’s atmosphere to physically affect humans on the ground, however—when intense enough—they can disturb the atmosphere in the layer where GPS and communications signals travel.

To see how such space weather may affect Earth, please visit NOAA’s Space Weather Prediction Center at spaceweather.gov, the U.S. government’s official source for space weather forecasts, watches, warnings and alerts.

This flare is classified as an X1.5-class flare.

X-class denotes the most intense flares, while the number provides more information about its strength. An X2 is twice as intense as an X1, an X3 is three times as intense, etc.

Featured image: This image comes from the Atmospheric Imaging Assembly telescope/94 Angstrom channel, which shows solar material at about 10 million degrees Fahrenheit. Credit: NASA/SDO


Provided by  NASA

Threatened by the Sun’s Superflare? LAMOST and TESS Help to Find the Answer (Planetary Science)

Superflare is an energetic stellar activity, whose explosion energy can be more than ten thousand times that of a typical solar flare. They erupt tremendous energies in just hour-scale duration, which will definitely ruin the planetary system nearby.  

A research team led by Prof. WANG Fayin from Nanjing University, cooperating with Dr. WANG Haifeng from Yunnan University, used the photometric data from TESS and the spectroscopic data from LAMOST to explore superflares on solar-type stars, whose surface temperature and gravity are similar to that of the Sun. 

The researchers found that a single solar-type star is capable to generate superflares, however, the Sun might not generate superflare due to generally lower chromospheric activity compared with other solar-type stars.  

The results were published in The Astrophysical Journal Supplement Series.  

Since July 2019, TESS began its 2nd year mission to observe the northern hemisphere of the sky, while LAMOST has been spectroscopically observing since 2012. They provide powerful data support for the study on stellar superflares.

The Large Sky Area Multi-Object Fiber Spectroscopic Telescope, or LAMOST for short, is operated by the National Astronomical Observatories of Chinese Academic of Sciences (NAOC).

In this work, the researchers found 1,272 superflares of 311 solar-type stars from the TESS data, and over 7,454 solar-type stars in the TESS catalogue have corresponding LAMOST spectral data, among which 79 stars generated superflares.  

Using the LAMOST spectral data, they estimated the stellar S-index, which is closely related to stellar spots. The value of S-index is positively correlated with stellar magnetic strength.

Meanwhile, TESS not only provides the opportunity to search for superflare events with stellar light curves, but also gives the chance to estimate stellar spots coverage rate (Rvar) of the stars. The Rvar value is directly related to the capability of a star for generating superflares.  

Fig. 2 Distribution of S-index and Rvar of the solar-type stars. (Image by TU Zuolin)   

The researchers found that those flaring stars apparently show relatively higher S-index and Rvar than other none-flaring stars. Furthermore, compared with S-index and Rvar of the Sun, flaring solar-type stars are much more active.  

“Our work confirms that a single solar-type star can generate superflares,” said TU Zuolin, the first author of the study. “We might be safe, because the possibility of the Sun to generate superflares and destroy the Earth is low.”

In the future, the researchers will use more spectroscopic information including medium-resolution surveys from LAMOST to understand the physical mechanism of superflares on solar-type stars, more deeply and comprehensively. 

Featured image: Cartoon image showing the Sun’s superflare, the Earth and Moon (Image by TU Zuolin)   


Reference

Superflares, Chromospheric Activities, and Photometric Variabilities of Solar-type Starsfrom the Second-year Observation of TESS and Spectra of LAMOST


Provided by Chinese Academy of Sciences

Are Solar Active Regions Formed By Large Twisted Flux Tubes? (Planetary Science)

By investigating a fundamental topological quantity called “magnetic winding”, MacTaggart and colleagues found first direct evidence that, solar active regions are formed by large twisted flux tubes. Their study recently appeared in Arxiv.

Solar active region is an area with an especially strong magnetic field. These regions frequently spawn various types of solar activity, including explosive “solar storms” such as solar flares and coronal mass ejections (CME). Several studies theoretically suggested that the basic structure of an active region is created by the emergence of a large tube of pre-twisted magnetic field. But, there has not yet been any direct observational evidence of the emergence of large magnetic flux tubes. Thus, the question arise, whether the solar active regions are formed by large twisted flux tubes, or not?

But, MacTaggart and colleagues now answered this question and provided evidence to support this by investigating a fundamental topological quantity called “magnetic winding” in solar observations.

They showed that, when magnetic winding is combined with other measurable quantities such as magnetic helicity, it provides a powerful analysis tool which can give direct information about magnetic topology or provide direct evidence that large twisted flux tubes emerge to create solar active regions.

“Despite its close connection to magnetic helicity, magnetic winding can behave very differently in an evolving magnetic field and, hence, provide new and distinct information.”

They have also given examples of active region observations where the magnetic winding gives a clear indication that the emerging magnetic field is composed of pre-twisted magnetic field. This confirms the prediction made by theoretical studies that, pre-twisted flux tubes play a fundamental role in active region formation.

Figure 1: Winding accumulation for AR11318. It is clear from this figure that the emergence accumulation (Lemerge) dominates strongly over the braiding accumulation (Lbraid) , and so the winding input is due primarily to the emergence of a pre-twisted structure rather than an untwisted structure whose twist develops in the solar atmosphere due to photospheric motions. © MacTaggart et al.

Finally, they suggested that the pre-twisted magnetic field that emerges into the photosphere represents a source to explain, self-consistently, the shearing, rotational and compressional motions invoked in models of coronal mass ejection formation. These motions can develop due to the transportation of twist into the higher atmosphere as the magnetic field expands into the corona.

“Although we have presented evidence that twisted flux tubes can create active regions, it is likely that other magnetic topologies also emerge to create active regions. This is an important area of research, for which magnetic winding will play a pivotal role.”

— concluded authors of the study

Featured image: Simulation of the initial emergence of a twisted magnetic tube: It shows the emerged flux tube, at 𝑡=2500 seconds, which has been deformed significantly by convection and developed a “serpentine” field line structure. © MacTaggart et al.


Reference: David MacTaggart, Chris Prior, Breno Raphaldini, Paolo Romano, Salvatore Guglielmino, “Direct evidence: twisted flux tube emergence creates solar active regions”, Arxiv, pp. 1-20, 2021. https://arxiv.org/abs/2106.11638


Note for editors of other websites: To reuse this article fully or partially kindly give credit either to our author/editor S. Aman or provide a link of our article